

Methods Used
Contextual Inquiry
Stakeholder mapping
user interviews
personas
customer journey map
1
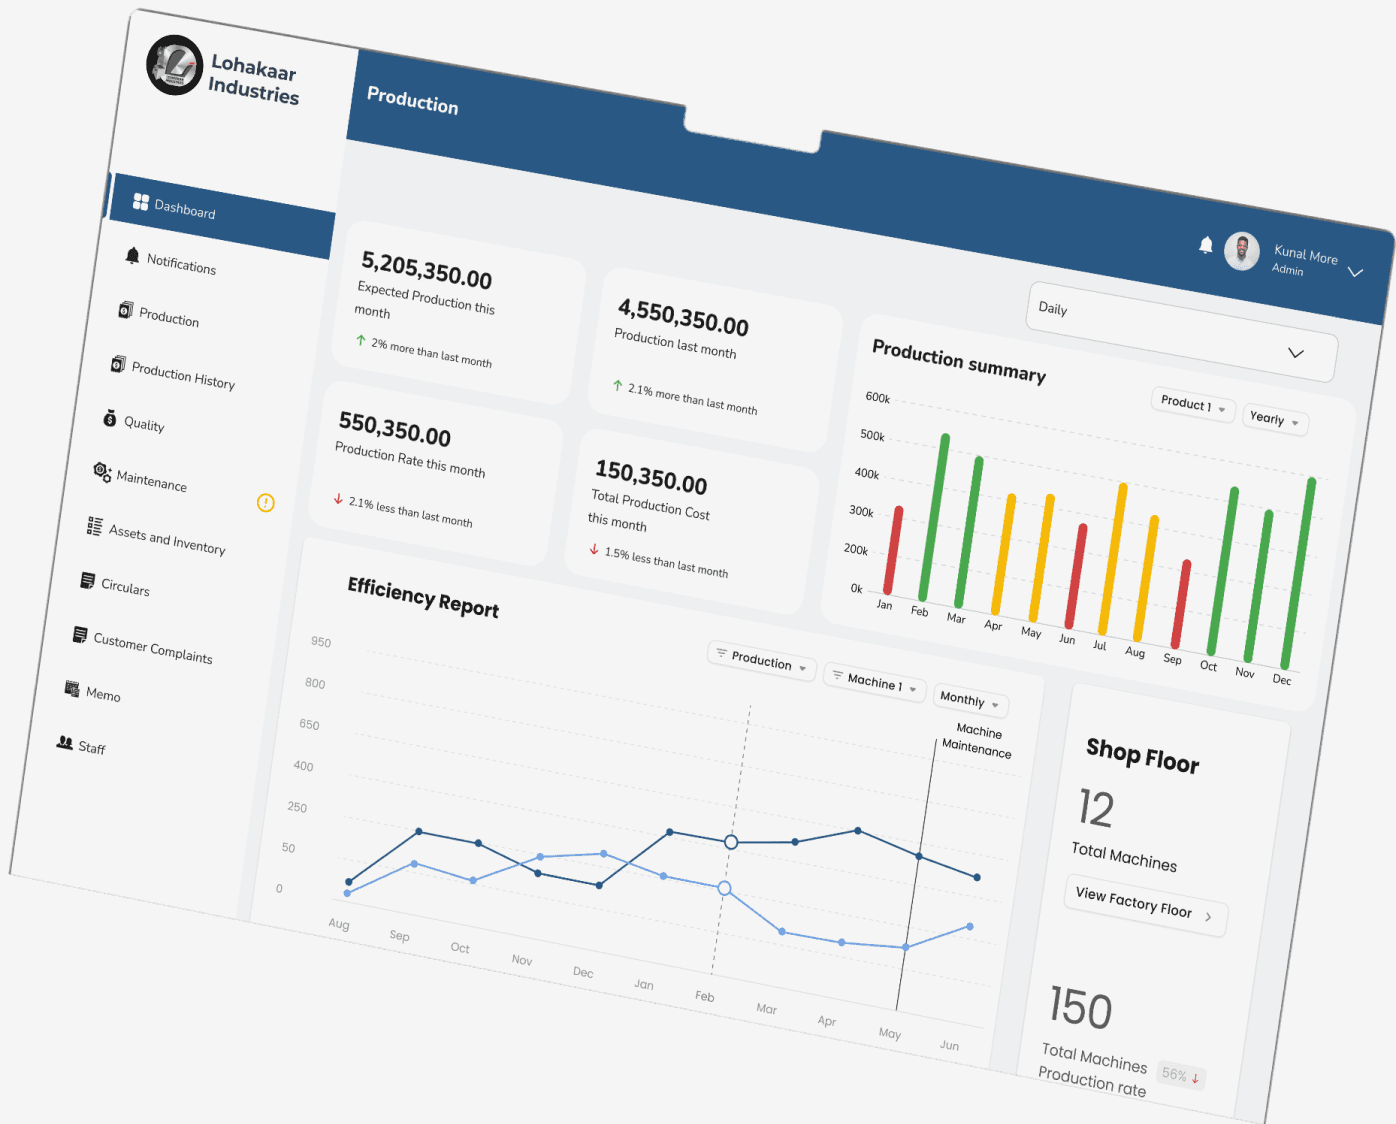
Production Dashboard
View daily targets, actual production, cost per unit, and production summary graphs.
2
Maintenance Tracker
Schedule, monitor, and view upcoming maintenance tasks through a calendar view.
3
Quality Check Module
Record and track quality issues, inspections, and defect rates.
4
Employee Management
Add and manage staff details, roles, and assignments across departments.
5
Department-wise Access Control
Role-based access for operators, supervisors, managers, and admin.
6
Reports & Analytics
Exportable reports on production output, downtime, quality metrics, and costs.
7
Notifications & Alerts
Automated reminders for maintenance, production delays, and quality flags.
8
Simple User Interface
Clean, minimal design tailored for ease of use by on-ground operators.
9
Mobile-Friendly Views
Accessible dashboards and forms on tablets or mobile for floor-level access.
Kunal
Managing Director
50 / Male
Rajesh is a strategic thinker and oversees the entire business operation. With decades of experience, his focus is on growth, efficiency, and staying competitive. He checks reports regularly and prefers quick, high-level insights to make fast decisions.
Pain Points
Lack of consolidated reports for real-time decision-making
Over-reliance on manual updates or Excel sheets from supervisors
Delayed visibility into production issues or quality failures
Meena
Plant Manager
38 / Female
Meena manages day-to-day factory operations, ensuring targets are met and quality is maintained. She coordinates with all departments and is often under pressure to resolve issues quickly. She prefers a structured dashboard with actionable data.
Pain Points
Switching between multiple formats and sources for data
Delays in updates from supervisors
Missed maintenance schedules leading to downtime
Sanjay
Machine Operator
29 / Male
Sanjay handles specific machinery and reports daily tasks to his supervisor. He prefers simple, clear instructions and values tools that help him log updates easily. He is less tech-savvy but quick to adapt if tools are user-friendly.
Pain Points
Manual logging is time-consuming and error-prone
Lack of awareness of maintenance schedules or task changes
Difficulty understanding reports or forms not designed for him

Of daily operations were tracked manually using paper logs.
Of supervisors reported difficulty in accessing production or maintenance records.
Of the staff expressed a need for centralized dashboards.
Defining Objectives
Core Objective
what outcomes do we want to see?
1
Lack of Digital Systems
Lohaakar Industries currently manages operations manually or with basic tools like Excel, leading to data loss, errors, and inefficiencies.
2
Role-specific Needs
Each stakeholder—from operators to managers—has distinct requirements. Operators need simple task tracking, while managers need dashboards for overview and planning.
3
Limited Visibility
Supervisors and the Plant Manager face challenges in monitoring real-time production status, quality issues, and maintenance schedules.
4
Gap in Existing ERP Solutions
Competitor analysis showed that most available ERPs are either too generic or overly complex for small-scale manufacturing setups.
5,205,350.00
Expected Production this month
2% more than last month
4,550,350.00
Production last month
2.1% more than last month
550,350.00
Production Rate this month
2.1% less than last month
150,350.00
Total Production Cost this month
1.5% less than last month
Production summary
Product 1
Yearly
600k
500k
400k
300k
200k
0k
Jan
Feb
Mar
Apr
May
Jun
Jul
Aug
Sep
Oct
Nov
Dec
Production
250
Parts Produced daily
12 more than last quarter
Quality
17%
Average scrap rate
0.2% lower than last quarter
Maintenance
₹10
Maintainnence cost
2% more than last Last Year
Cost Analysis
₹10
Quality cost impact
2% more than last quarter
Production Rate
Machine 1
Monthly
950
Aug
2020
2021
Sep
Oct
Nov
Dec
Jan
Feb
Mar
Apr
May
Jun
800
650
400
250
50
0
Machines
Feb 2021
Machine 1
230
Machine Maintenance
Shop Floor
12
Total Machines
View factory Floor
273.76
Total Machines
Production rate
56%
View More
Daily
Logo

Dashboard
Production History
Assets and Inventory
Circulars
Memo
Staff
Production

Kunal More
Admin
Quality Assurance
Quality Check Forms to maintain quality across products.
Daily Check Lists
First Piece Inspection and Process Monitoring
In process & Last Piece Inspection Report
Inhouse Rework,Repair & Suspected Product Analysis and Corrective Actions
Cost of Poor Quality
Rejection analysis and Disposal Record
Check Lists to be filled when needed
Receiving Inspection report and Raw Material Test Certificate
Final/Predispatch Inspection Report
Process Validation Report
Temporary change of Process change Matrix
Deviation Note
Customer Complaint Analysis & Corrective Action (8D) & Procedure
Product /Process Change Management
APQP
4R
PPAP
Yearly Check Lists
First Piece Inspection and Process Monitoring
In process & Last Piece Inspection Report
Inhouse Rework,Repair & Suspected Product Analysis and Corrective Actions
Cost of Poor Quality
Rejection analysis and Disposal Record
Quality

Kunal More
Admin
Logo
Dashboard
Production History
Assets and Inventory
Circulars
Memo
Staff
5,205,350.00
Expected Production this month
2% more than last month
4,550,350.00
Production last month
2.1% more than last month
550,350.00
Production Goal Today
150,350.00
Current Production Counter
1.5% less than last month
Production summary
Product 1
Daily
600k
500k
400k
300k
200k
0k
Mon
Tue
Wed
Thu
Fri
Sat
Sun
Mon
Tue
Wed
Thu
Fri
Production Data Entry
Enter hourly production data for tracking and analysis
Item name
Select item
Hour
Select option
Date
DD/MM/YYYY
Operator
Enter Operator Name
Product Type
Select option
Counter
Enter Counter
Rejection
Enter Rejection
Parts Produced (Calculated)
Enter Parts Produced (Calculated)
Downtime (min)
Enter Downtime
Rejection Reason
Enter Operator Name
Downtime Reason
Enter Operator Name
Comments
Save Production Record
Logo
Dashboard
Production History
Assets and Inventory
Circulars
Memo
Staff
Production

Kunal More
Admin
Update Photo
Allowed format
JPG, JPEG, and PNG
Max file size
2MB
First name
John
Last name
Otor
Email address
Enter email address
Phone number
Enter phone number
Gender
Select gender
Staff ID
Staff ID
Department
Select Department
Designation
Select Designation
Official email
Official Email
Submit
Add Staff
Back
Staff

Kunal More
Admin
Logo
Dashboard
Production History
Assets and Inventory
Circulars
Memo
Staff
Color Pallete
Nunito
Aa
Aa Bb Cc Dd Ee
Lato
Aa
Aa Bb Cc Dd Ee

solutions

impact
impact


Title
Lorem ipsum dolor sit amet, consectetur adipiscing elit. Faucibus in libero risus
01


Let’s Create Something Amazing!
View More